Prime Big Deal Days is over. Check your stock before Black Friday finds the gap
A sales drop after Prime Big Deal Days often hides a stockout. A five-step check across Amazon.ca and Amazon.com before you plan the Black Friday restock.
Prime Big Deal Days ran October 6 and 7 on Amazon.com and Amazon.ca. If it went well, your FBA stock is thinner than it was last week. FBA (Fulfillment by Amazon) means Amazon stores your units and ships your orders. Black Friday is about seven weeks away. If a product's sales dropped during or after the event, the reflex is to blame the ads, the ranking or the listing. Often the cause is simpler. The product ran out somewhere, for a few days, and nobody saw it.
Here is the five-step check we run the week after a big event. Do the steps in order. The fifth is where most people start, which is why they fix the wrong thing.
1. Read stock for each day of the window
The stock number in Seller Central (Amazon's dashboard for sellers) is today's number. It says nothing about what you had on October 7.
We learned this the hard way. Looking at a product whose sales had collapsed, we saw healthy stock, units on the way and an active listing, so we went hunting for a ranking problem. The product had been out of stock for three weeks. The healthy number was the restock that had just landed. Worse, the period we were comparing sat inside the gap. We were measuring the hole.
Two places show you the past. The Inventory Ledger report (in Seller Central, under Reports, then Fulfillment) shows your stock movements and balances by date. Your ad data is the other. In our experience, Sponsored Products ads stop serving when the product can't be bought. So a run of days with ad impressions near zero is the quickest sign of a stockout. An impression is one time your ad was shown.
2. Check Canada and the US separately
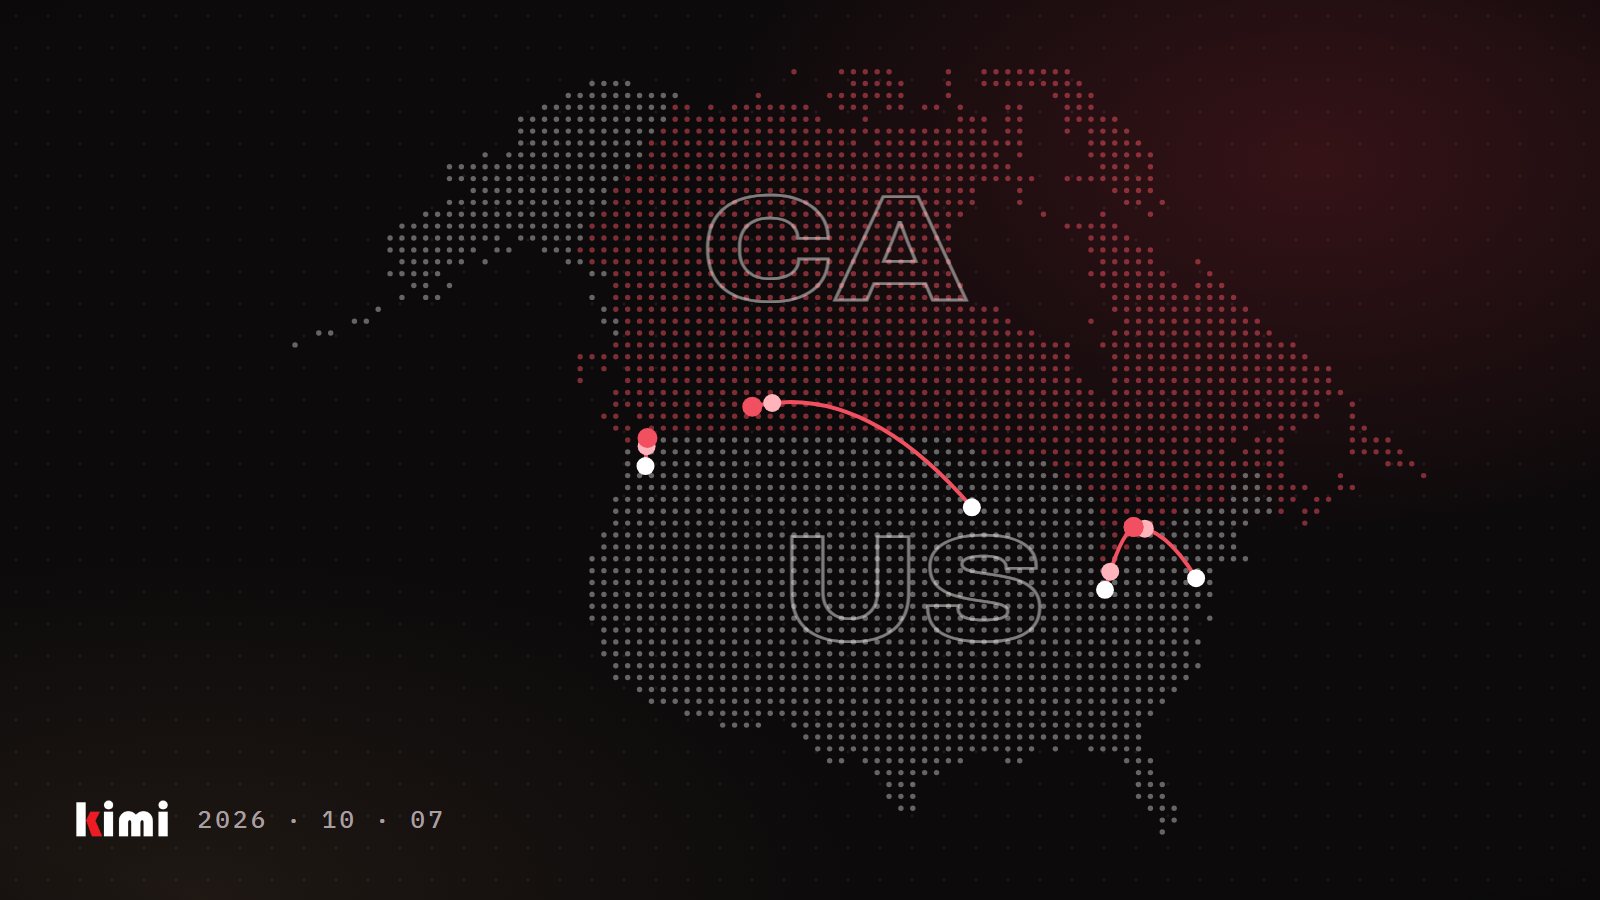
Amazon.ca and Amazon.com are separate marketplaces, and in our experience the stock behind each one has to be read on its own. A product can be fine in the US and sold out in Canada, and a combined view will hide it.
When you pull the Inventory Ledger grouped by country, the file can carry rows for both countries, with a location column marking each row CA or US. We have seen a report pulled for Canada show plenty of units. Filtered to Canadian locations, it showed a near-empty shelf. A receipt that looked like a Canadian delivery had landed in the US. Unfiltered, that report would have cancelled a purchase order Canada needed.
So filter by location before you total anything. Then check that your Canadian total from the ledger lands close to the available units Seller Central shows for Amazon.ca. If it is far higher, US rows are still in it.
Canada also needs its own timeline. Cross-border shipments go through customs, and in our experience they take longer to reach Canadian fulfillment centres than a domestic US shipment takes to reach a US one. Plan the Canadian restock first.
3. Look at your FBA capacity before you plan the inbound
FBA capacity limits cap how much inventory you can send to and store at Amazon. Amazon sets a monthly limit, measured by volume in cubic feet, and shows it in the Capacity Monitor in Seller Central, with estimates for the coming months. A related tool, Capacity Manager, lets you request more space for a future period.
Most planning sheets miss this. In our experience, you can't pull that limit into a spreadsheet or a planning tool through Amazon's data connections. You can work out how much space your stock uses. The limit itself has to be read in Seller Central and typed in by hand. If your Q4 restock plan was built without that number, it may not fit.
So open Capacity Monitor before you size the order. Check the limit for each month from now to the end of December. If you sell items classed as dangerous goods, such as aerosols or some batteries, check that space too. In our experience it is tracked as its own pool. And look up the holiday inbound dates in your Seller Central account this week.
4. Compare full windows
The three days after a sales event will always look weak next to the event. Shoppers bought early. Compare like with like: the two weeks before the event, the event itself, and the two weeks after.
Before you trust any window, check it against the stock timeline from step 1. If a stockout sits inside it, that window measures the gap. Watch for coincidences as well. A sister product can jump in the same weeks another one drops and look like it is stealing sales, when the two are unrelated.
5. Only then look at ads, price and the listing
If stock was there every day in both countries and sales still fell, now look at demand. Split it into stages. Few impressions means a traffic problem: bids, budget or search relevance. Impressions without clicks points to the main image, the title or the price as shoppers see it in search. Clicks without orders points to the detail page, the price or the reviews.
Check budgets first. In our experience, a campaign that hits its daily budget during an event stops showing for the rest of that day, which looks like falling demand.
If you did run out, expect the restart to cost more. After a stockout of a few weeks, we usually see ad spend climb to buy back the traffic that organic rank used to bring for free. Treat it as a time-boxed investment with a review date about two weeks out. If traffic holds but returns are not climbing back, rank is not returning, and it is time to stop funding it.
In our experience, a sales drop after an event is a stock story far more often than a marketing story. Check the days, the countries, your space and the windows. If all four are clean, turn to the ads and the listing. With about seven weeks to Black Friday and Cyber Monday, an afternoon spent on this now can save you an empty shelf in late November.