Judging Prime Big Deal Days: read your results without fooling yourself
Your deal event numbers will look worse than they are for two weeks. How to judge ads, stock and real volume before you decide on the next deal.
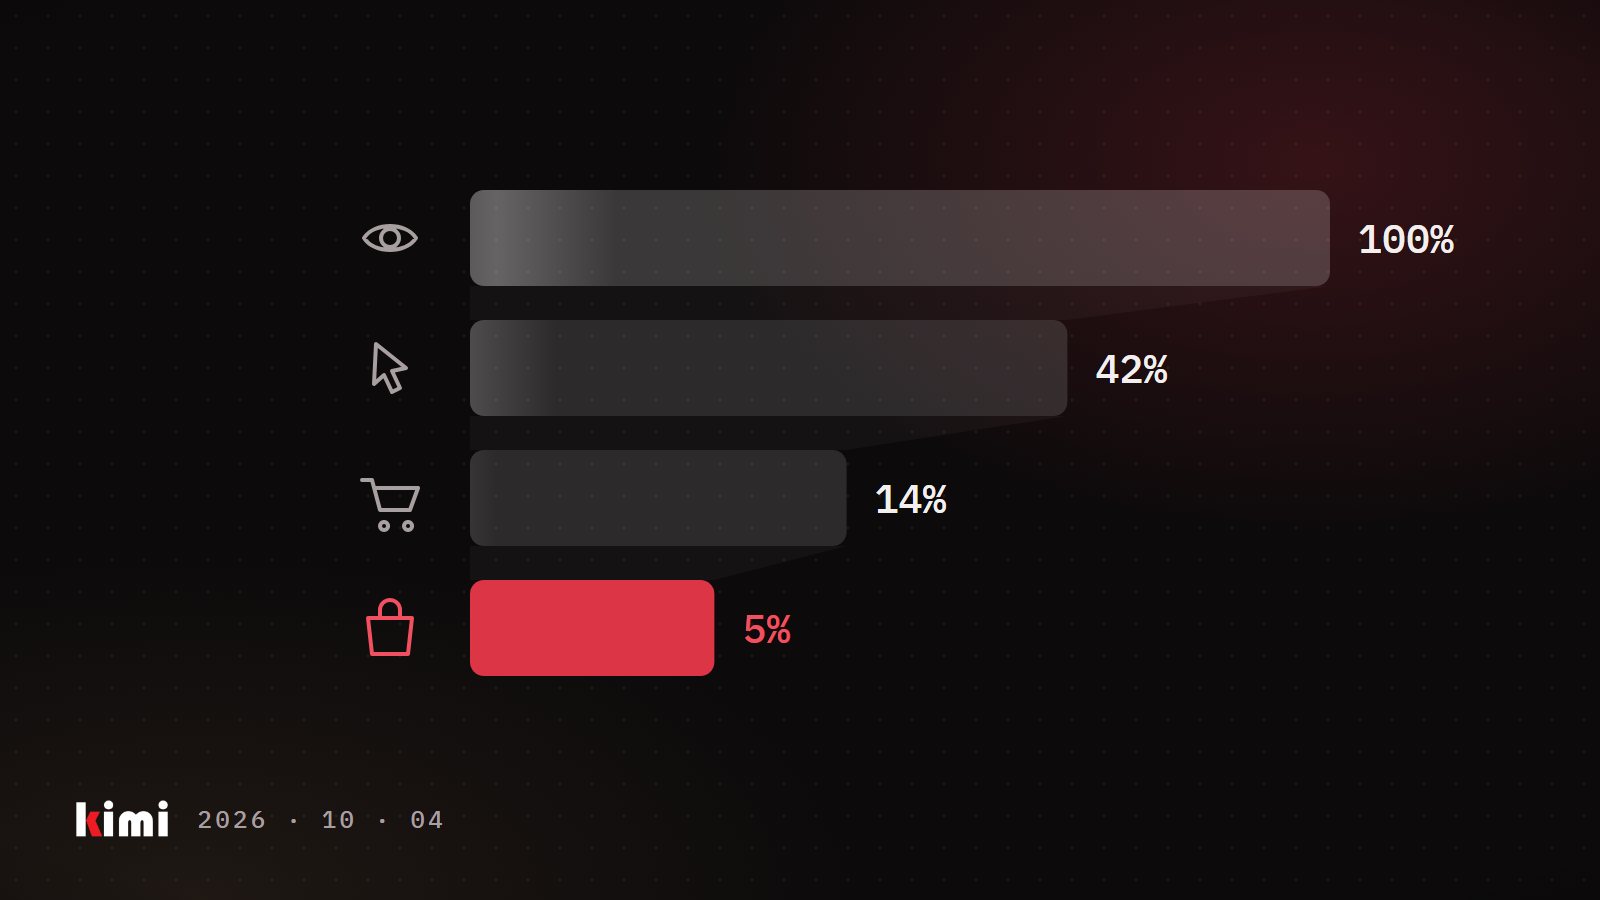
Prime Big Deal Days runs October 6 and 7 on Amazon.com and Amazon.ca. A day later you will open Seller Central (your seller account) and the ad console, and the numbers will already tell a story. Often it is the wrong one. The event days look weak, ACoS looks high, units look flat against last year, and the urge is to cut ad spend or skip the next deal. Most of those calls are made too early, on numbers that are still moving.
Here is how we judge a deal event on the accounts we run: four checks, in order, before anyone decides anything.
Wait for the ad sales to finish arriving
Amazon credits a sale to an ad when the shopper buys within a set number of days after clicking. That period is the attribution window. Amazon's campaign metrics help gives 7 days for Sponsored Products and 14 days for Sponsored Brands. A shopper who clicks your ad on October 7 and buys on October 12 still counts, and the sale is tied back to the day of the click.
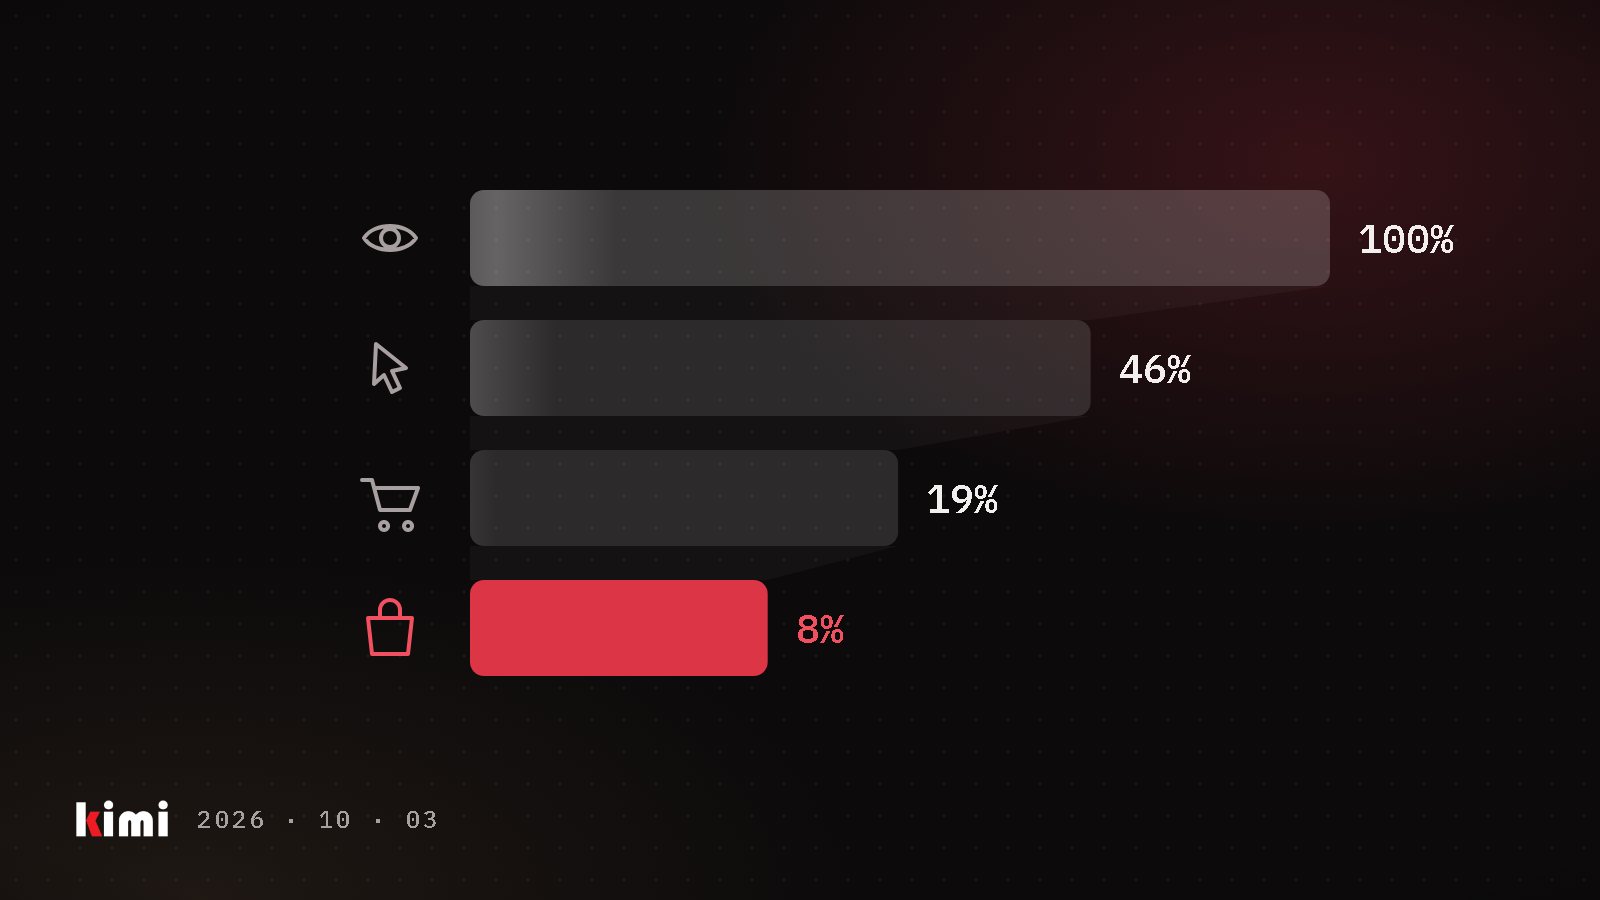
So any window that ends yesterday is incomplete. Spend shows up right away. Sales keep landing for days. The most recent days always show too few ad sales, which makes ACoS (advertising cost of sales: ad spend divided by ad revenue) look too high and ROAS (return on ad spend, its inverse) look too low. Put that young window next to an older, settled one and the event looks like a collapse.
In our experience this is the most common way a good event gets judged as a bad one. We have seen campaigns flagged as wasting money that were only waiting for their sales to be credited. Our rule: for any diagnosis, use windows that ended at least 14 days ago, and compare blocks of the same age. For this event, your first fair read of October 6 and 7 comes on or after October 22. Don't pause campaigns or cut bids off the event days before then.
Rule out a stockout before you blame ads or price
Deal days pull stock fast. If a product ran out during or right after the event, every number after that point is about inventory. Amazon says it plainly: if your product is out of stock or isn't presenting the featured offer, your ad will not display. The featured offer is the Buy Box, the offer with the Add to Cart button.
Here is the trap. You check inventory today, see healthy stock and an active listing, and cross stockouts off the list. Today's inventory describes today. The units you see may be the restock. What you need is availability during the days you are judging.
The cheapest check we know is your own ad data. Pull daily impressions for the campaigns on that product. If impressions fall to near zero for a run of days and nothing changed in your campaigns, the product was most likely unbuyable. Then open Business Reports in Seller Central, under Detail Page Sales and Traffic by Child Item, and check the featured offer percentage to see whether another seller held the Buy Box during the event.
In our experience, a product that goes dark for weeks loses organic position, and ads cost more per order for a while as you buy that traffic back. Treat that as a time-boxed investment: if ad efficiency hasn't started to recover a few weeks after the restock, stop funding it.
Convert Amazon units into real product
In our experience, an Amazon "unit" is one sellable listing as the shopper buys it. A 3-pack counts as one unit and is three jars off your line. During an event, pack mix moves a lot, because shoppers chase whichever size is on deal. Units can drop while the product you shipped went up, and the reverse.
Illustrative example: last October you sold 1,000 single jars. This October you sold 600 units, 300 singles and 300 3-packs. Units are down 40%. Jars are 300 + 900 = 1,200, up 20%. If sizes differ, convert to weight or volume.
Build a simple map for every listing: how many pieces in the pack, and what size each piece is. Report units and real volume side by side. When revenue and units move far apart, price or pack mix changed. Split those out before you call it a volume change. Your production and your margin follow the product that leaves your line.
Decide whether to run it again
With settled data, stockouts ruled out and volume in real product, compare three blocks: the 14 days before the event, the event days, and the 14 days after. That last block needs two weeks of its own to settle, so the full picture lands in early November.
Did real volume rise during the event and drop below normal after? A deal that only pulls next week's orders forward did less than it looks. Where did the lift come from? Walk the path in order: impressions, then clicks, then orders, and find the step that moved. Did ACoS rise because of the discount? A lower price means less revenue per order. Illustrative example: $10 of ad spend per order on a $40 product is a 25% ACoS. At a $30 deal price, the same ad work reads 33%. Judge the event on margin per order after discount, fees and ads.
Read Amazon.com and Amazon.ca separately. The event runs on both, the currencies differ, and you run separate campaigns in each. In our experience the two markets rarely react the same way to the same deal, so one combined number hides the answer for both.
A deal event gives you two days of data and a strong urge to act on it. Give the ad sales two weeks to land, prove the product was buyable, and count what left your line. Then decide about the next event on numbers that hold still.