Reading the Search Query Performance report without a data team
Amazon already shows brand owners where shoppers drop off on each search term. How to read Search Query Performance in an hour.
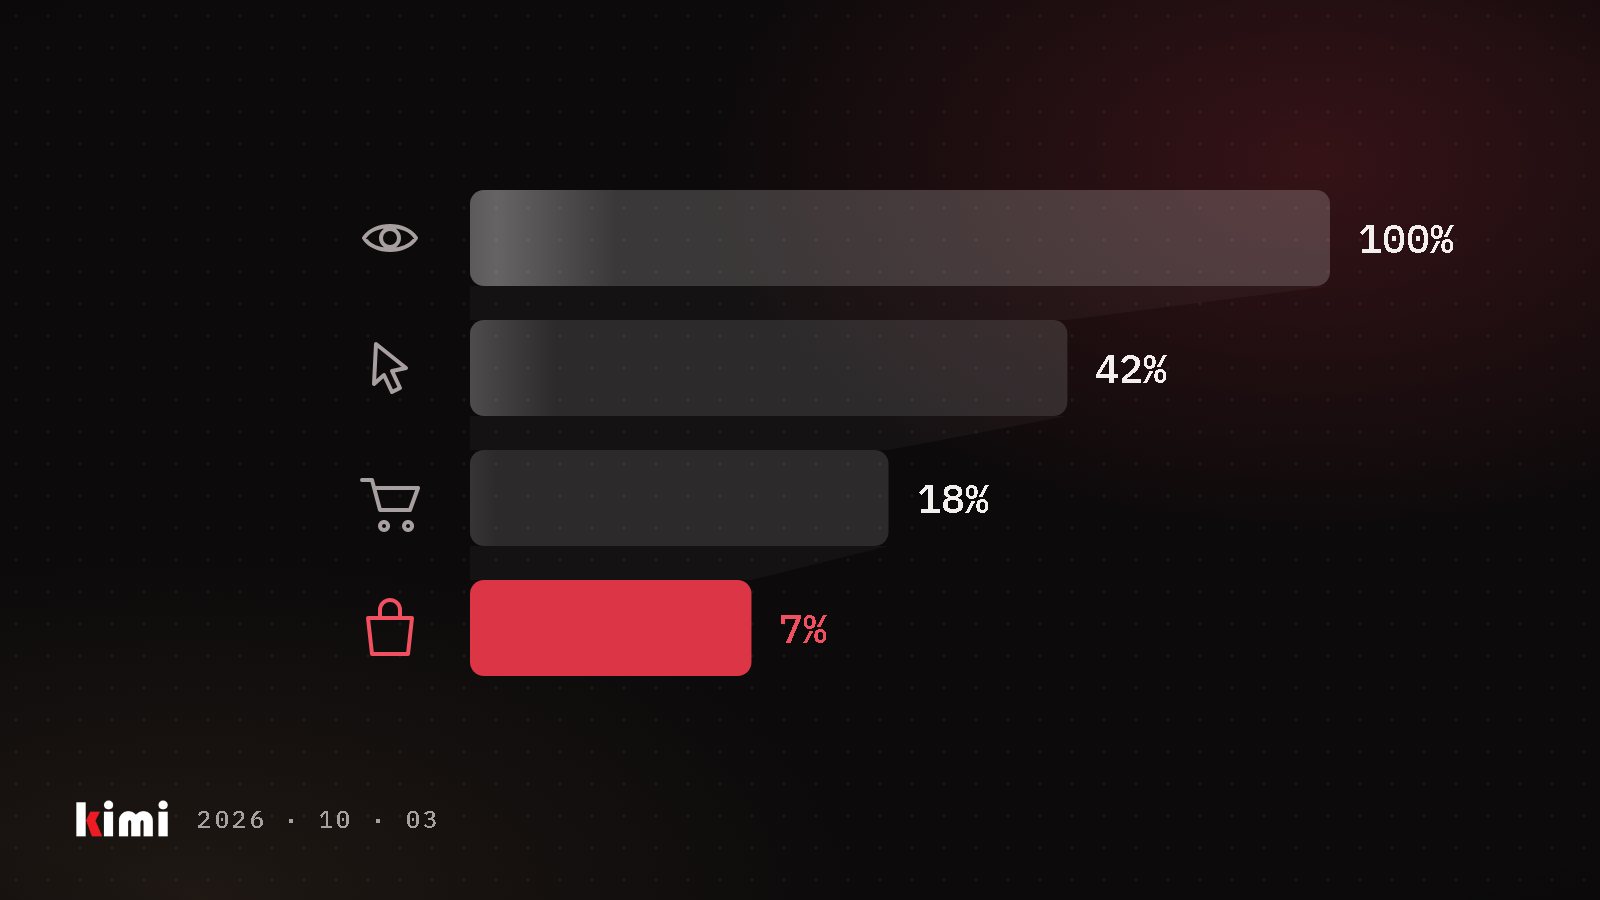
You know your sales. You probably know your ad spend. What most brand owners can't answer is the part in between: when someone searches for the thing you make, do they see you, do they click you, and do they buy? Amazon answers that question term by term, in a report most brands never open because it looks like a spreadsheet built for analysts. You need four columns and about an hour.
What the report is and who can see it
Search Query Performance, usually shortened to SQP, is a dashboard inside Brand Analytics, Amazon's reporting suite for brand owners. In Seller Central you find it under Brands, then Brand Analytics, in the Search Analytics section. To open it you need a Professional selling account and the Brand Representative role for a brand enrolled in Brand Registry, Amazon's program for trademark owners. Amazon lists both requirements.
One detail matters if an outside partner runs your Amazon business. Amazon's Reseller role, the one it describes for authorized distributors with a selling agreement, does not include Brand Analytics. Your partner may never have seen this data. You can pull it yourself and share the export.
What's in it
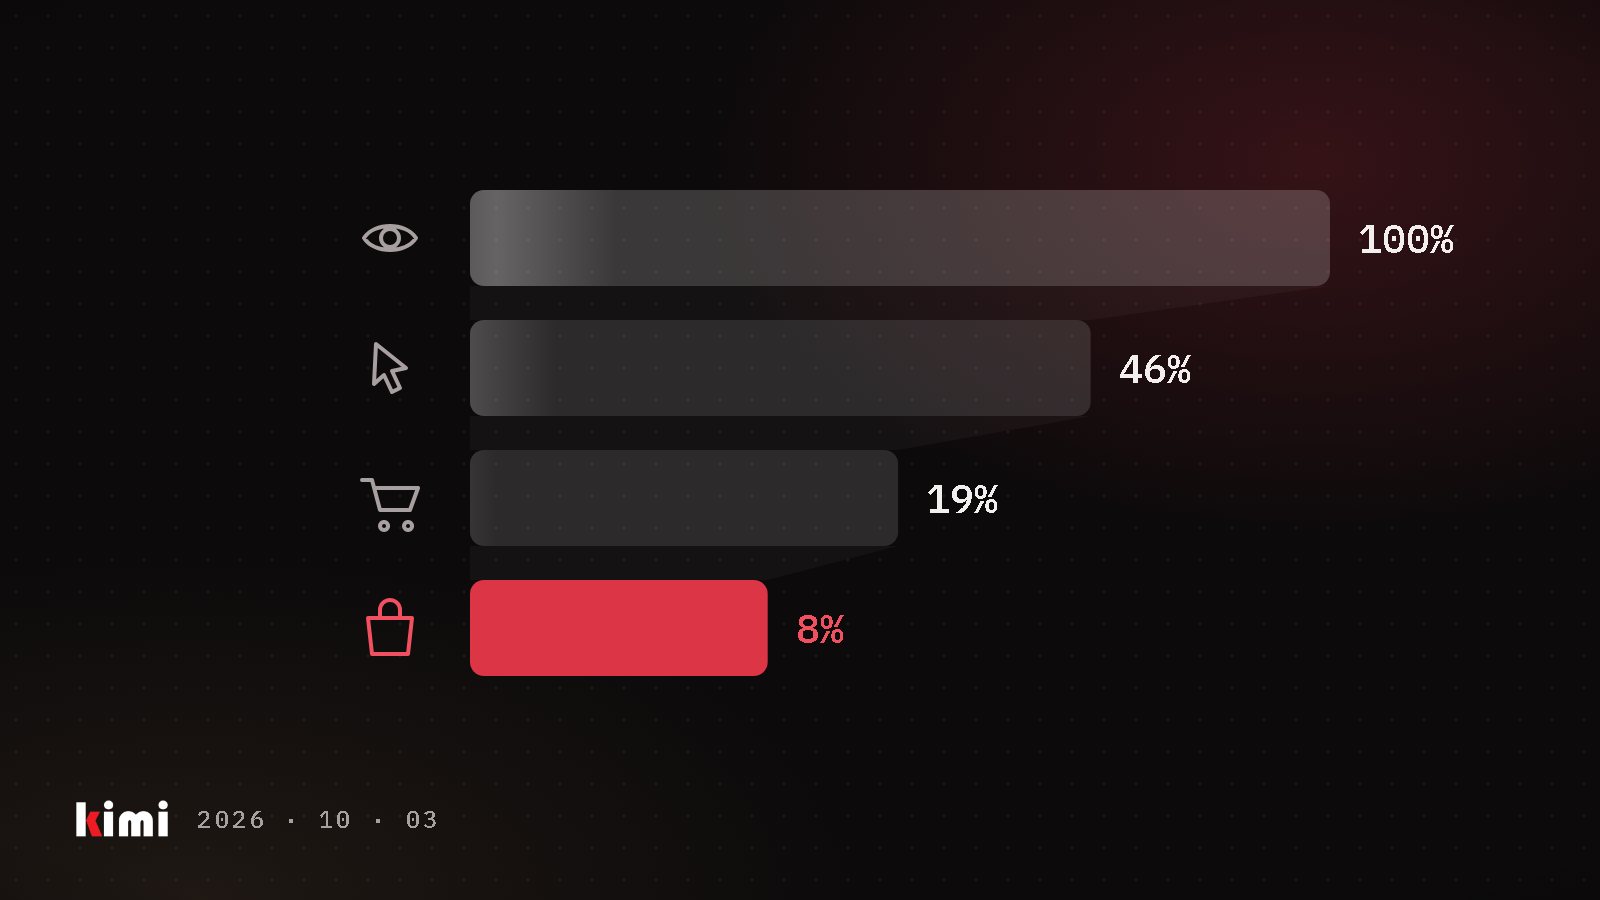
For each search term that led shoppers to your products, SQP puts the whole market's funnel next to yours: impressions, clicks, cart adds and purchases. At each stage you see the total for all brands, your count, and your share. Amazon describes it as your brand's share of performance compared with overall query performance in the store.
- Brand view or ASIN view. The brand view blends your whole catalogue. The ASIN view (an ASIN is Amazon's ID for one product) shows one product at a time. Decisions come from the ASIN view.
- Week, month or quarter. Amazon's report documentation lists all three periods. Weekly data on a smaller product is thin, so start with a month or a quarter. Amazon says Brand Analytics data is generally available within three days, and quarter-end data within a week.
- Median price and delivery speed. For each term the report shows the median price of what shoppers clicked, added and bought, and how same-day, one-day and two-day delivery split the clicks and purchases.
- Search only. An Amazon staff answer confirms that every SQP metric is specific to search results. Your total sales will always be higher than the purchases SQP shows.
What it won't show you is an individual competitor. Every comparison is you against the total market.
How to read it in four steps
Download the ASIN view for your best seller, for the last full month or quarter. Sort by purchases, then work down the terms that matter.
- Drop the noise. Skip terms with only a handful of clicks. One click and one sale on a tiny term tells you nothing.
- Line up your shares. Put impression share, click share, cart add share and purchase share side by side. The stage where your share falls is where shoppers leave you.
- Name the leak. A fall from impressions to clicks points at what shoppers see in the results: main image, title, price, review count. A fall from clicks to cart adds points at the detail page. A fall from cart adds to purchases often points at price or the delivery promise.
- Check the median price. Compare your price with the median click price on the term. If shoppers on that search buy at a much lower price point, an image or a bid won't close the gap.
An illustrative example, not real data: on one term you hold 4% of impressions, 2% of clicks, 2.4% of cart adds and 3% of purchases. You lose half your share at the click, then win most of it back on the page. Shoppers who reach your listing like it. The work is in the search result: the main image, the title and the price they see next to everyone else's.
The opposite pattern matters just as much. If your purchase share beats your impression share on a term, you convert better than the market there and simply aren't seen enough. That is where extra ad spend is most likely to pay.
What running it on real accounts taught us
Three lessons from using SQP on the brands we manage.
- Price can be the whole story. We've audited products where SQP showed almost no purchases from search, and the median click price on every intent term sat far below the product's price. New photos would not have fixed that. The useful move was to focus spend on the terms where the price already competes, and to justify the premium on the page.
- Visibility is often the real limit. On other products, search purchases were a small slice of total sales and impression share on the big terms was tiny. The listing converted well. It just wasn't being seen.
- Small products may show nothing. For low-volume items the report can come back empty. When that happens we read the advertising search term report instead, which holds conversion data for every term you've paid for.
You don't need a data team to use SQP. You need one product, one month and four columns. The report tells you whether your problem is being seen, being clicked or being chosen, and each of those has a different fix. Knowing which one you have is most of the work.
Sources
- Amazon Brand Analytics (eligibility and dashboards)
- Amazon Brand Analytics: get data to grow your business
- Brand Registry roles (Brand Representative vs Reseller)
- SP-API analytics report types: Search Query Performance
- Chris Rawlings: Amazon PPC Full Course 2026 (SQP benchmarking segment)
- Helium 10 / Bradley Sutton: Reviving an Amazon Brand On Life Support (SSP 754)
- My Amazon Guy: Amazon SEO & Listing Optimization, the 5-Phase Ranking Strategy